Monitoring Quality Assurance Processes in a MAT :: OMAT

One of the advantages of a Multi Academy Trust (MAT) over a school operating alone is the access to a larger pool of pedagogical and educational expertise. This holds the potential to raise the performance of each school within the trust to the level of the highest in each domain, indeed, the trust is accountable for maintaining high standards in all schools.
However, it also presents the increased complexity of managing quality assurance (QA) over not one school but many, often covering different stages of education and student demographic profiles.
Background
A comprehensive understanding of the QA processes is necessary at the MAT level for two reasons.
- To account for rigorous and consistent QA processes in all schools for which the trust is responsible.
- To deploy the resources of the trust, including the expertise of its member schools, to where they can provide the greatest advantage.
This is readily interpretable as a data problem; data on the QA processes needs to be recorded in a centrally accessible location, tracked to ensure consistent oversight, and presented in a manner that highlights trends in performance.
Implementation
Version 1
Data collection
Collecting the data on the QA activities was accomplished through a Microsoft form which needed to straddle two competing aims. It needed to be unrestrictive enough that the user was able to reflect the full conclusions of the activity without constraint. For example, if the conclusion was that the target of the investigation was performing well, but had significant weaknesses in certain areas, a simple score or would have ignored much of the variance within the area under examination. However, the score also needed to be presentable as data; a freeform text field would allow the assessor to describe precisely what they had seen, but the analysis of this data would have required some kind of textual analysis or AI support, which would make the solution complex to deliver and introduce accuracy concerns.
The design of the form was iterative, with an initial draft being presented to the Director of School Improvement to record QA activities in, and report back on areas where they felt they were unable to fully reflect the outcome of the QA. The resultant form broadly included;
- Details of the QA activity, such as who conducted it, at which school, how and when, chosen from a list.
- The focus of the investigation chosen from a list.
- In some instances, such as attendance, this was sufficient, but in others, such as curriculum, the subject area was also then required. To avoid making the user work through a list of all focus areas and sub-areas, this was split into several questions with branching. E.g. if you answered ‘Attendance’ for this question (1), you would move straight to question 3. However, if you answered ‘Curriculum,’ you would be required to complete question 2 on subject area first
- Strengths, areas for development and recommendations as free text.
- These were text fields but struck the right balance between being identifiable as data without being too restrictive on the assessor. Indeed, in the discussions surrounding this it was mentioned that some level of restriction would be helpful to provide a standardising structure to the investigation.
- Of the three recommendation fields, only one required an answer, the latter two were optional. Again, this reflects that requiring at least one was a desirable outcome of the investigation.
- Assurance level chosen from a list.
- Much discussion was had on the exact terms used for assurance that would strike the right balance between holding meaning but not seeming threatening or condescending. We settled on;
- Highly Assured
- Assured
- Developing
- Action/Intervention
- Much discussion was had on the exact terms used for assurance that would strike the right balance between holding meaning but not seeming threatening or condescending. We settled on;
- Any further comments as text.
- Link to Associated documents as a URL link (text).
Data presentation
This form was used as the data source for a PowerBI report. The focus of the report was a matrix visual with a hierarchy of Schools >Terms as columns. Another measure of the foci, with curriculum foci replaced with the specific subject, and the Assurance activity as a drill down field, was used for the rows. The most recent assurance rating was used as the value, and conditionally formatted with RAG colours.
The effect was to highlight areas of poorer QA results, and the results that followed to demonstrate progress made, broken down by school. Where multiple assurance activities were used, these can be accessed by drilling down into the foci.
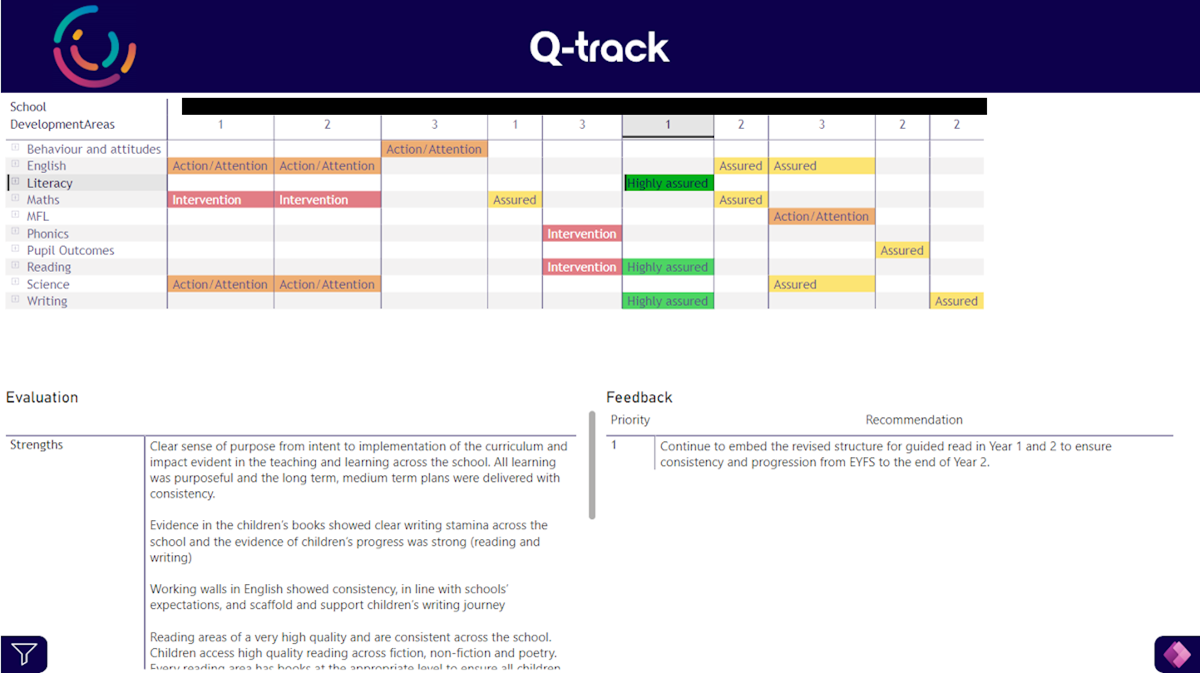
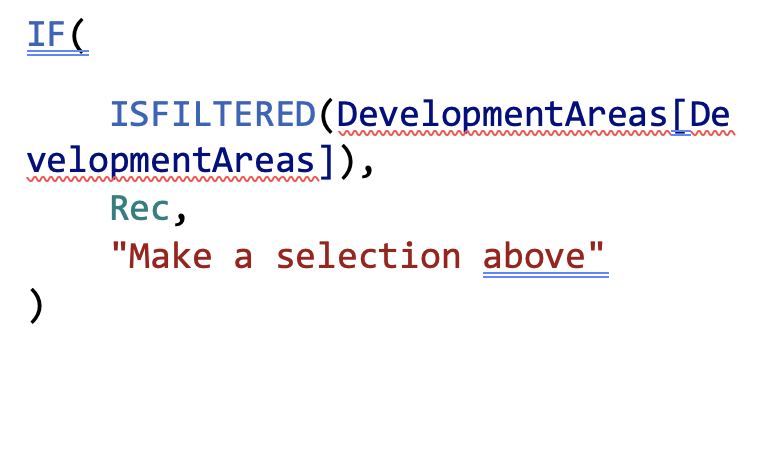
Other visuals were used to return the Strengths/Areas for improvement/ Recommendations etc. when a specific case was selected in the matrix. If no case was selected, a message reading “Make a selection above” showed. The DAX code used to produce this result was;
Access
The PowerBI report was stored in a workspace which staff had row-level security (RLS) access to. That is that the heads of the school would access with the ability to see only data pertaining to their school, as though the school filter were fixed. Central staff would have full access and were able to see all school’s data. It is also possible to post these reports to Bromcom, our MIS (Management Information System). Doing so would have allowed access to users without PowerBI Pro licenses, while maintaining the RLS, but this was not desirable in this instance.
Issues
The main issue we found with this approach was that the information required for the MS Form was not always available at the same time. Further discussion may have been required before an assurance level was settled upon, or the level may be changed upon reflection. This required that the user alter their data after it was submitted, which is not practical with MS Forms.
Additionally, the spreadsheet containing form responses must be located under the same user as the Form itself, and this caused some issues with refreshing the data.
Version 2
Data collection
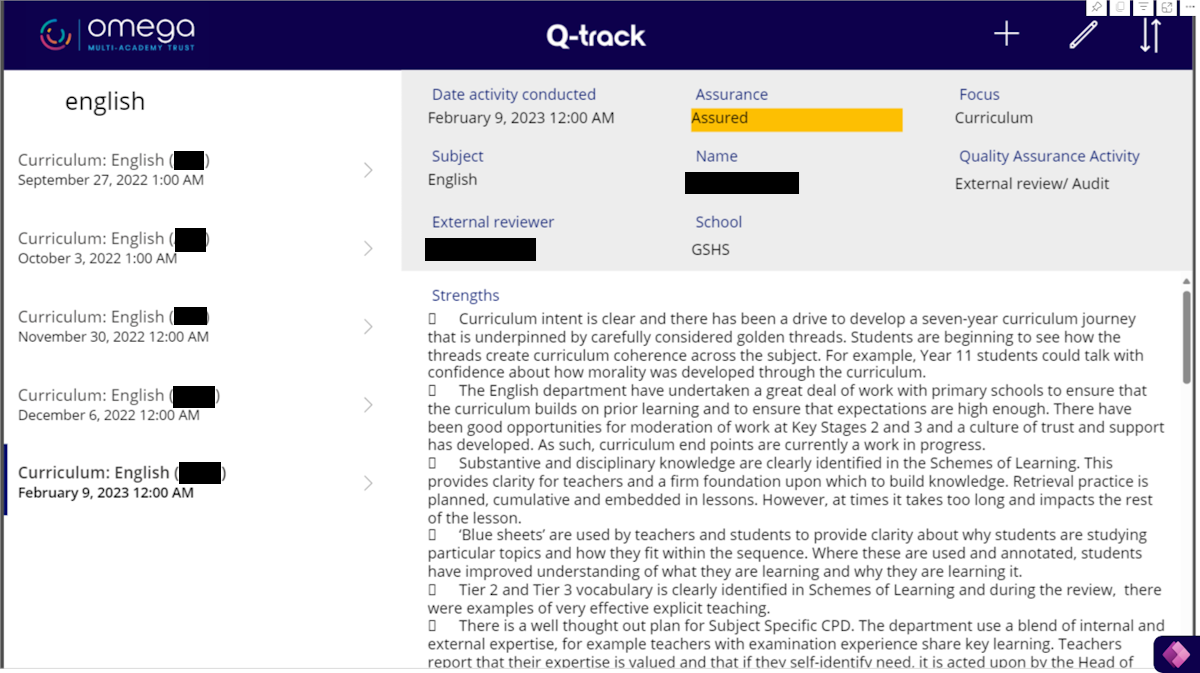
To resolve the above issues, data collection was conducted via PowerApps instead. An app was created that would sit on top of a spreadsheet and allowed access to the records held within that sheet in a user-friendly manner. Users could view existing records and edit or create new records using the buttons in the top right. The form retained the same data points as were present in the MS Form with the branching represented through greying out text boxes.
Data presentation
The PowerBI report was retained, and a link to the PowerApp was added in the bottom, mirroring a tab used to access report filters without compromising on screen space. This means that users can access, edit, and create records from the same page. One benefit of this is that users now only need access to the PowerBI report, also available by the PowerBI app, to both analyse QA and create new records. It would also be possible to remove the text fields in the report, as this data is available in the PowerApp, but for convenience this has been retained.
Issues
The one issue with this new approach is that using the PowerApp to edit or create a new record does not immediately reflect in the PowerBI report. Whilst it is possible to set a refresh schedule for the report every half hour during the day, this would not make the data update instantaneous as the user might expect. We have presently set the refresh to be daily and there is a note explaining this within the report.
Skills development
This project has been heavily dependent on the use of PowerBI (PBI). However, the datasets used are not complex or large, so a simple data architecture sits behind the PBI report and PowerApp;
- The QA dataset, that also sits behind the PowerApp
- A term time dataset, that allows filtering by year/term
- A year group organisation dataset that allows filtering by year, but also key stage or phase
- An unused recommendation tracker, that in version 1 would provide the option to record when recommendations have been actioned.
In version two this would be added as an unused column in the main QA dataset and edited through the PowerApp
The visuals required measures to be created, so an intermediate knowledge of DAX was required.
This project was my first attempt at using PowerApps, but comprehensive training in this project is freely available on the Learn Microsoft website here.
The project also required close communication with the users, primarily the Director of Education and School Development Partner. This brought on the expertise of how the product would be used, and how it could be most useful, which is important to have an expert view on.
Impact
The system is only a recent development and is still in the process of being fully rolled out and utilised, but the early reviews are positive. The system is used in Executive meetings to identify areas of concern and ensure that they are appropriately targeted. Data on QA activities can be easily input either at a desk or using tablet PCs staff have access to.
Next steps
The highest priority is to improve the refresh of the dataset to reflect changes recently made. It may be possible to automate this to a button in the PowerApp. Alternatively, refreshing the dataset in PowerBI is not a complicated process.
Another function that has been discussed but not yet implemented is to create a linked tracker of the recommendations of each activity. This would allow users to mark when a recommendation has been actioned. This would be visually represented in the PowerBI report and would also include follow up on these recommendations in the QA process.
Additionally, creating a duplicate for the schools so that they can track internal QA processes is under consideration. These would be kept separate from the Trust QA so that the assurances contained are known to not be from staff at the schools themselves.
Conclusion
Quality assurance presents an excellent opportunity for data analysis. The resulting reports provide a straightforward way to view the outcomes of an ongoing QA process, as well as identify patterns early and be able to provide the resources to support where necessary. Additionally, they provide a demonstration of strong processes that support the development of schools.
It is possible to view this project as one where staff involved in QA requested a solution, this was delivered, and they were able to better conduct this role. However, the conversations that took place when designing this system were constructive as well. Reflecting a process like QA through pieces of software like PowerBI and PowerApps requires that all uses be considered, all transmutations of answers are planned for. This highlights areas that have not previously been considered and allows for the same processes that the system is for to become more systemised themselves. These conversations have been of mutual benefit to both parties and highlight the advantages of an organisational approach with a significant role for data.
Max Bradley
Omega MAT
Read more case studies
View all
Strategic Progress Reporting & MAT Census :: OAT

Implementing MAT Dashboards with Google Tools :: FCAT