Implementing MAT Dashboards with Google Tools :: FCAT

The purpose of this report is to provide a comprehensive overview of the implementation and impact of MAT Level Dashboard Reports with Google tools within our organisation. MAT Level Dashboard Reports serve as a critical component of our data management and reporting infrastructure, enabling us to consolidate and analyse core data from individual SIMS instances across the MAT. By leveraging a combination of innovative technologies and methodologies, we have established a centralised platform for generating interactive dashboard reports that provide valuable insights into various aspects of educational performance and student outcomes.
Background
The implementation of MAT Level Dashboard Reports with Google tools represents a strategic initiative aimed at enhancing our organisation’s data management and reporting capabilities. Historically, data aggregation and analysis across the MAT have been fragmented, with individual academies maintaining separate SIMS instances and reporting mechanisms. This decentralised approach posed significant challenges in terms of data accessibility, consistency, and accuracy, hindering our ability to gain comprehensive insights into educational performance and inform strategic decision-making.
To address these challenges, we embarked on a journey to centralise core data from individual SIMS instances into a unified MAT database. Leveraging a combination of batch files, SIMS CommandReporter, Microsoft SQL Server Integration Services (SSIS), and Google tools, we developed a robust framework for extracting, transforming, and loading data from SIMS to a central database. This framework not only streamlined the data aggregation process but also ensured data integrity and consistency across the MAT.
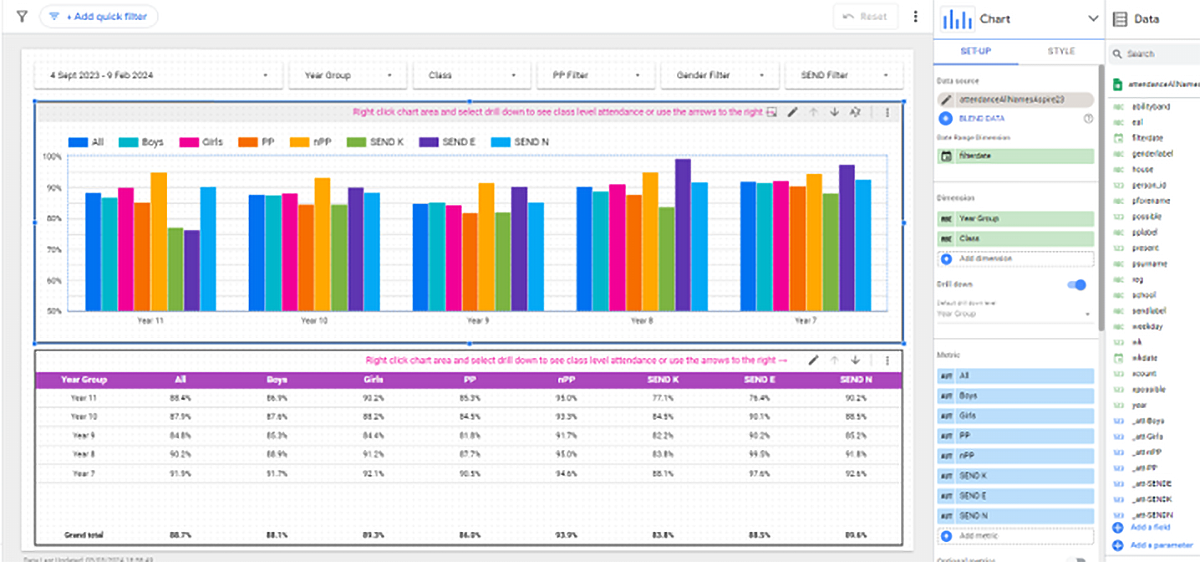
Additionally, the integration of Google tools, including Google Drive, Google Sheets, and Google Looker Studio, played a pivotal role in facilitating data visualisation and reporting. Google Drive provided a secure and accessible platform for storing and sharing data files, while Google Sheets served as a flexible and scalable data source for generating dashboard reports. Google Looker Studio, with its powerful analytics and visualisation capabilities, enabled us to create interactive dashboard reports that provide actionable insights into attendance, behaviour, staff absence, and other key metrics across the MAT.
Overall, the implementation of MAT Level Dashboard Reports with Google tools marks a significant milestone in our organisation’s journey towards leveraging data to drive continuous improvement and enhance educational outcomes. As we continue to refine and expand our reporting capabilities, we remain committed to leveraging emerging technologies and methodologies to further enhance our data management and reporting processes.

Implementation
The implementation of MAT Level Dashboard Reports with Google tools involved a meticulous process leveraging various technologies to streamline data aggregation and reporting. Utilising a central Windows Server machine with a SQL Server licence as the hub, daily scheduled tasks were executed to extract data from individual SIMS instances to CSV files. This was facilitated through batch files containing CommandReporter commands, automating the data extraction process.
Subsequently, Microsoft SQL Server Integration Services (SSIS) played a crucial role in importing, extracting, transforming, and loading data from CSV files into the central database. SSIS packages were configured to execute SQL tasks and save query results to a Google Drive shared folder, accessible through Google Drive for Desktop installed on the server. This seamless integration between Microsoft and Google technologies facilitated efficient data transfer and storage.
Google Looker Studio was then employed to create interactive dashboard reports, utilising Google Sheets as a free data source. For each CSV generated by SSIS package exports, a corresponding Google Sheet was created, augmented with AppsScript code to import data on a scheduled basis. These data sources were instrumental in calculating key metrics, such as attendance percentages for various cohorts, providing valuable insights into educational performance across the MAT.
While Microsoft solutions offer robust functionality, the approach of utilising Google products provided several advantages. Google tools, being free for education, resulted in significant cost savings for the organisation. Additionally, the user-friendly interface of Google Looker Studio and Google Sheets allowed for quicker adoption and easier collaboration among stakeholders.
However, there were some drawbacks to this approach. Google tools may not offer as extensive functionality as Microsoft solutions, particularly for complex data transformations and analysis. Furthermore, compatibility issues may arise when integrating Google tools with existing Microsoft infrastructure, requiring additional effort for configuration and maintenance.
Impact
The implementation of MAT Level Dashboard Reports has yielded significant positive impacts on our organisation’s data management and reporting processes. By centralising data from disparate SIMS instances, we have achieved a streamlined and cohesive approach to data aggregation and analysis. This has resulted in improved efficiency and accuracy in generating comprehensive dashboard reports, facilitating informed decision-making at both the central team and MAT-wide levels.
The accessibility and user-friendliness of Google tools have empowered collaboration among stakeholders, enabling seamless sharing and dissemination of dashboard reports across the MAT. This enhanced transparency and communication have fostered a culture of data-driven decision-making, empowering educators and administrators to identify trends, monitor progress, and implement targeted interventions to support student success.
Overall, the implementation of MAT Level Dashboard Reports with Google tools represents a significant milestone in our organisation’s journey towards leveraging data to drive continuous improvement and enhance educational outcomes across the MAT. As we continue to refine and expand our reporting capabilities, we remain committed to leveraging emerging technologies and methodologies to further enhance our data management and reporting processes.
Skills Development
Completing the MAT Level Dashboard Reports project required me to acquire and apply a diverse set of skills, building upon my existing background in web technologies and database design. Here’s a breakdown of the skills I had to pick up and use throughout the implementation process:
Data Integration and ETL
I delved into data integration concepts and tools, particularly Microsoft SQL Server Integration Services (SSIS). Learning how to extract data from SIMS instances, transform it to meet reporting requirements, and load it into a central database was crucial for the project’s success.
Database Management
I deepened my understanding of database design principles and SQL Server management. This involved tasks such as database normalisation, indexing, and query optimization to ensure efficient data storage and retrieval.
Google Tools Proficiency
I familiarised myself with various Google tools such as Google Drive, Google Sheets, and Google Looker Studio. Learning how to leverage these tools for storing data, performing analysis, and creating interactive dashboard reports was essential.
Scripting and Automation
I acquired scripting skills in languages like JavaScript for Google Apps Script and PowerShell for Windows Task Scheduler. These skills were instrumental in automating routine tasks like data extraction, transformation, and report generation.
Web Development
I brushed up on my web development skills, particularly HTML, CSS, and JavaScript, to customise dashboard reports and integrate them into existing web applications for wider accessibility.
Data Analysis and Visualization
I learned how to analyse data and create meaningful visualisations using Google Looker Studio. Understanding how to translate raw data into actionable insights through interactive dashboards was a key aspect of the project.
Next Steps
Moving forward, we aim to further optimise and expand our dashboard reporting capabilities. This includes refining data transformations within SSIS to ensure accuracy and efficiency in reporting. Additionally, we plan to explore advanced features and functionalities offered by Google Looker Studio to enhance the depth and sophistication of our dashboard reports. Furthermore, we will continue to evaluate and integrate emerging technologies and methodologies to continuously improve our data management and reporting processes.
Conclusion
In conclusion, the integration of MAT Level Dashboard Reports with Google tools has significantly enhanced our organisation’s data management and reporting infrastructure. By amalgamating batch files, SSIS, and Google technologies, we have effectively centralised crucial data from individual SIMS instances, facilitating the creation of comprehensive dashboard reports. The adoption of Google tools, which are available at low or no cost for educational institutions, has not only resulted in substantial cost savings but also provided us with user-friendly interfaces that foster quicker adoption and smoother collaboration among stakeholders.
Moving forward, we remain committed to refining and expanding our reporting capabilities to foster informed decision-making and drive continuous improvement across the MAT. As we navigate this journey, we will continue to explore advanced features offered by Google Looker Studio and other emerging technologies, ensuring that our data management and reporting processes remain at the forefront of innovation and efficiency.
Pete Montgomery
Fylde Coast Academy Trust
Read more case studies
View all
Strategic Progress Reporting & MAT Census :: OAT

Streamlining Safeguarding - How Central Data Teams Enhance Trust Processes :: NPCAT