Leveraging Power BI for Enhanced Educational Data Analysis :: TBFT

In recent years, the landscape of education has undergone profound transformations, accelerated further by the challenges posed by the global pandemic. With this evolution comes an increased emphasis on utilising data-driven approaches to improve student outcomes and streamline administrative processes.
This case study explores how The Bishop Fraser Trust leveraged Power BI, a powerful data visualisation tool, to unlock insights and drive informed decision-making in the realm of education.
Background
The Bishop Fraser Trust recognised the need to adapt to changing data demands in education, particularly in the aftermath of the pandemic. Traditional methods of data analysis were proving insufficient in providing timely insights and fostering proactive interventions. The quest for a dynamic solution led to the adoption of Power BI, renowned for its flexibility and ability to integrate diverse datasets seamlessly.
Prior to implementing Power BI, The Bishop Fraser Trust grappled with several challenges typical in educational settings. These included:
- Data Fragmentation: Siloed data sources hindered comprehensive analysis and made it difficult to derive holistic insights.
- Time Constraints: Manual reporting processes consumed valuable time, limiting the capacity for in-depth data exploration and analysis.
- Resource Allocation: Identifying areas for improvement and allocating resources effectively required a more nuanced understanding of student performance and administrative trends.
Implementation
The adoption of Power BI presented a transformative solution to these challenges. By leveraging its capabilities, The Bishop Fraser Trust was able to:
- Integrate Diverse Data Sources: Power BI facilitated the seamless integration of disparate data sources, including pastoral and assessment data, as well as data from the Department for Education (DFE). Integrating other sources of data into the Trust picture provided a more panoramic view of educational analytics.
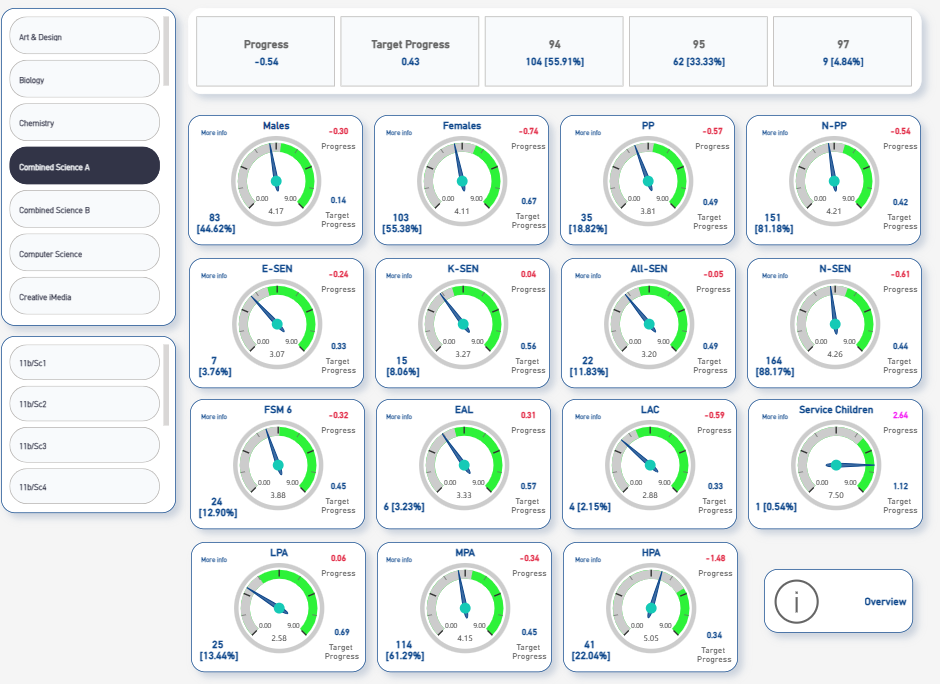
- Develop Bespoke Dashboards: Bespoke dashboards were developed to provide stakeholders with intuitive visualisations of key metrics, such as attendance rates, disciplinary actions, and academic performance. Through this harmonious amalgamation of aesthetic elegance and informational depth, Power BI empowered stakeholders with a transformative lens into the educational landscape.
- Real-Time Tracking: Direct integration with DFE data enabled real-time tracking of performance against national benchmarks, empowering educators to identify trends and areas for improvement promptly. Through this proactive surveillance infrastructure, Power BI metamorphosed into a catalyst for agile educational governance, fostering a culture of anticipatory responsiveness within the Trust.
- In-Depth Analysis: Freed from the constraints of manual reporting, The Bishop Fraser Trust was able to delve deeply into the data, uncovering both positive trends and areas requiring attention.
Skills Development
Data Integration and Cleansing: Understanding how to integrate disparate data sources is paramount. This involves learning techniques for harmonising data from various systems within the trust, such as student information systems, assessment databases, and attendance records. Additionally, acquiring skills in data cleansing is essential to ensure the accuracy and reliability of the data being integrated into Power BI.
Power BI Proficiency
Developing proficiency in using Power BI is fundamental. This includes familiarising oneself with the interface, learning how to connect to data sources, and mastering the creation of reports and dashboards. Investing time in exploring Power BI’s functionalities, such as data modelling, visualisation customisation, and dashboard interactivity, will be invaluable in harnessing its full potential for educational analytics.
Understanding of Data Visualisation Principles
Acquiring knowledge of data visualisation principles is essential for effectively communicating insights derived from Power BI dashboards. This involves learning about best practices in visual design, including choosing appropriate chart types, utilising colour palettes effectively, and designing user-friendly interfaces. Understanding how to create visually engaging and informative dashboards will enhance stakeholder engagement and facilitate data-driven decision-making within the trust.
Knowledge of Licensing Models
Understanding the licensing model for Power BI is crucial, particularly in the context of a small trust with limited resources. This involves learning about the different licensing options available, such as Power BI Pro and Power BI Premium, and their respective features and pricing structures. It also entails assessing the trust’s needs and budget constraints to determine the most suitable licensing arrangement.
Change Management and Stakeholder Engagement
Developing skills in change management and stakeholder engagement is vital for facilitating a smooth transition to Power BI within the trust. This involves effectively communicating the benefits of Power BI to stakeholders, addressing any concerns or resistance to change, and garnering buy-in and support from key individuals within the organisation. Additionally, fostering a culture of data-driven decision-making and providing training and support to staff members to ensure they feel confident and empowered to use Power BI will be essential for successful implementation and adoption.
Impact
The implementation of Power BI yielded tangible results for The Bishop Fraser Trust:
- Improved Decision-Making: Data-driven insights informed strategic decision-making processes, enabling targeted interventions to support student success and enhance operational efficiency.
- Enhanced Stakeholder Engagement: Intuitive dashboards facilitated transparent communication and collaboration among stakeholders, fostering a shared understanding of educational challenges and objectives.
- Optimised Resource Allocation: By identifying areas for improvement with precision, The Bishop Fraser Trust could allocate resources judiciously, maximising impact and efficacy.
- Cultivation of Data Culture: The utilisation of Power BI nurtured a culture of data-driven inquiry within the organisation, empowering educators to harness the power of data to drive continuous improvement
Next Steps
With the foundational skills in place, the next step in the implementation process is to conduct a comprehensive assessment of the trust’s existing data infrastructure. This involves identifying all relevant data sources, assessing their quality and compatibility with Power BI, and establishing protocols for data governance and security.
Following the assessment, the focus shifts towards designing and developing a tailored Power BI solution that meets the specific needs and objectives of the trust. This includes defining key performance indicators (KPIs) and metrics to be tracked, designing intuitive dashboards for stakeholders, and configuring data connections and transformations within Power BI.
Finally, as the implementation progresses, it is essential to prioritise ongoing training and support for staff members to ensure they feel confident and capable in utilising Power BI effectively. This includes providing hands-on training sessions, creating user guides and documentation, and establishing channels for ongoing support and troubleshooting. Additionally, continuous monitoring and evaluation of the Power BI implementation will be critical to identify any areas for refinement or improvement and ensure that the project continues to align with the trust’s overarching goals and objectives.
Conclusion
In conclusion, the adoption of Power BI has revolutionised the approach to data analysis in education for The Bishop Fraser Trust. By harnessing the platform’s capabilities, The Bishop Fraser Trust has unlocked valuable insights, optimised decision-making processes, and positioned itself at the forefront of educational innovation.
As the landscape continues to evolve, the commitment to leveraging data-driven approaches will remain paramount in driving positive outcomes for students and educators alike.
Mark Riddell
The Bishop Fraser Trust
Read more case studies
View all
Strategic Progress Reporting & MAT Census :: OAT

Implementing MAT Dashboards with Google Tools :: FCAT